
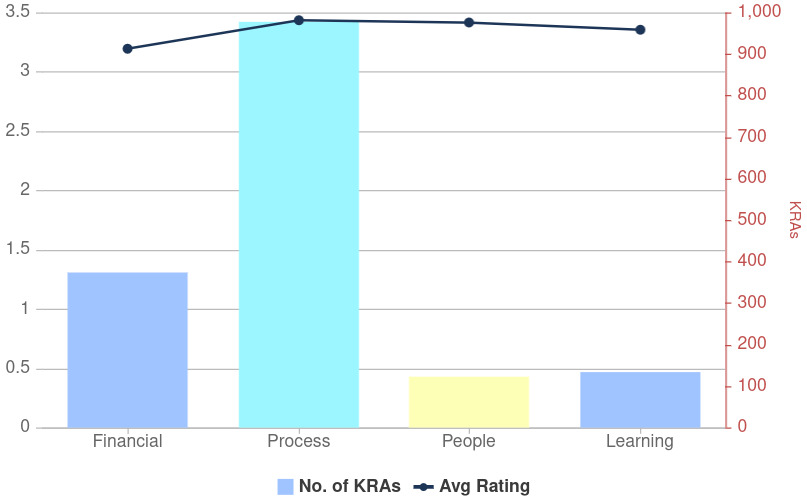
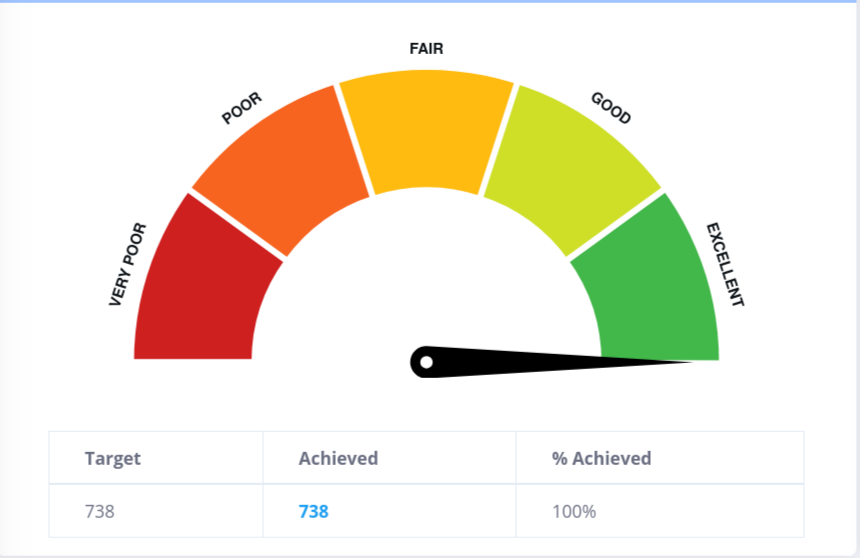
Balance Score Card
The Balance Score Card (BSC) in HR is a strategic performance management tool that tracks key metrics across areas like employee performance, productivity, and engagement, helping organizations align HR goals with overall business objectives.

Present vs Onleave
The Present vs On-Leave dashboard graph visually compares employees who are present and those on leave, helping HR identify attendance trends, monitor workforce availability, and analyze department-wise leave patterns efficiently.

Attendance Status
The Attendance Status dashboard provides a clear overview of employee presence, showing who is present, on leave, or absent, enabling HR to monitor daily attendance trends and ensure workforce availability.
Customer Activities
Customer Activities in ERP CRM capture every interaction, task, and engagement with clients. This gives frontline teams a complete activity history, ensuring personalized service and stronger customer relationships.

Meetings
Meetings in ERP CRM help frontline teams schedule, track, and manage customer interactions efficiently. They ensure timely follow-ups, stronger engagement, and improved relationship management.
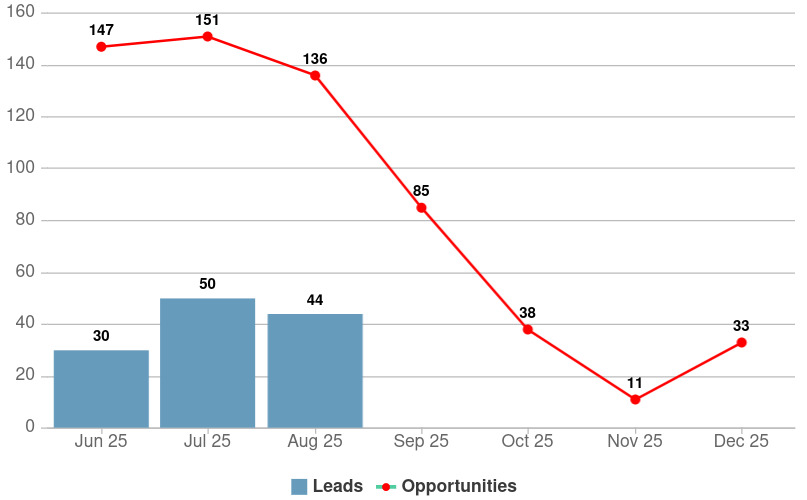
Month wise Leads and Opportunities
Month-wise Leads and Opportunities give frontline teams a monthly breakdown of new prospects and potential deals. This enables better tracking, trend analysis, and proactive planning to boost conversions and revenue.

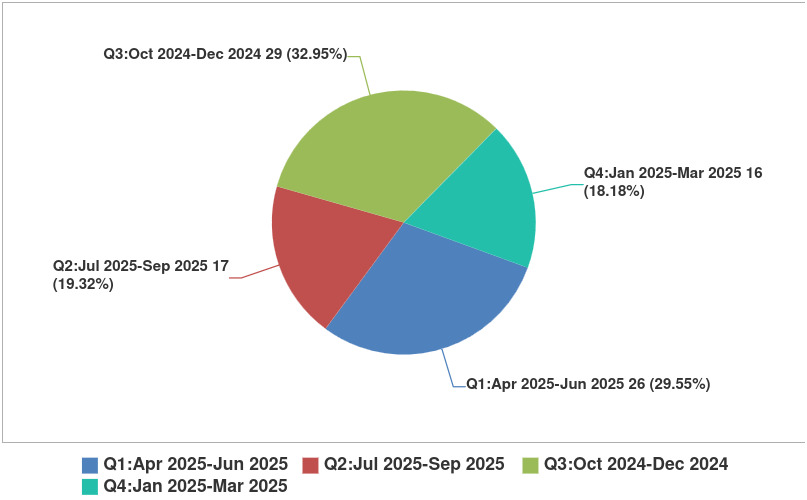
Month wise Opportunities
Month-wise Opportunities in ERP CRM provide a clear view of sales prospects segmented by month. This helps frontline teams track performance trends, forecast revenue, and plan actions more effectively.

Opportunities
Opportunities in ERP CRM capture potential deals and track their progress through the sales cycle. This enables frontline teams to focus on qualified prospects and maximize revenue growth.
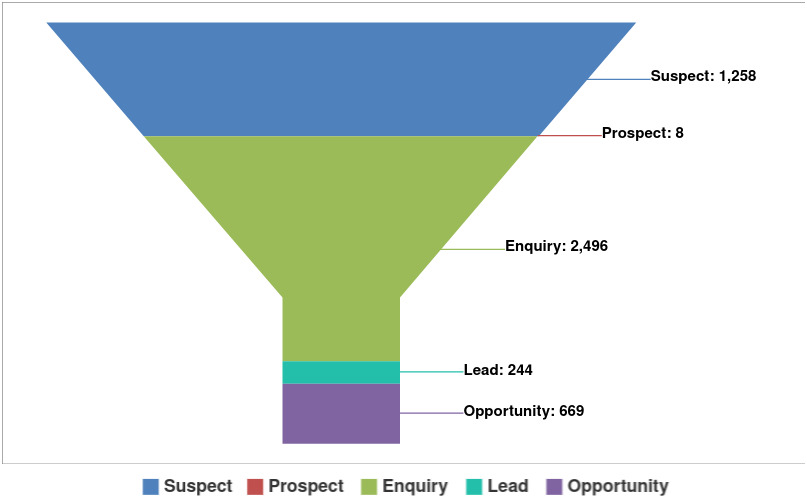
Sales Pipeline
Sales Pipeline in ERP CRM provides a structured view of every sales opportunity, from lead generation to closure. It helps frontline teams track, prioritize, and manage deals effectively for higher conversions.
Target
Target Management in ERP CRM helps set clear sales goals for frontline teams and track their progress in real time. It ensures alignment with business objectives by monitoring achievements against defined targets.
Frequently Asked Questions
What is Analytics Management?
Analytics Management involves using data analysis tools to gather, interpret, and utilize data to make informed decisions. It helps organizations understand trends, monitor performance, and optimize operations.
How can I use the Analytics tools?
Access the Analytics tools to set up dashboards, create reports, and visualize data. Use these features to track key performance indicators, analyze trends, and make data-driven decisions.
What features are included in data visualization?
Data visualization features include charts, graphs, and interactive dashboards that help you interpret complex data more easily. Customize visualizations to highlight key metrics and trends relevant to your business.